
Updated on 2022-07-26
Data pipeline with Python, MySQL and AWS
In this project, I created an ETL process to move real estate data from the RapidAPI website to a relational database. With the API provided by that website, it was possible to access the data using Python and load it into the MySQL database. Finally, the entire process was transferred to the cloud and automated using AWS services.
The data extracted is about sale, rental and sold properties in New York City. The complete code and instructions of how to reproduce this project are on Github.
Environment
To execute this project, I used Python 3.10 language and MySQL 8 database. Also, I use requests package to extract data from the API, pandas for data manipulation and pymysql to connect to the database.
Execution
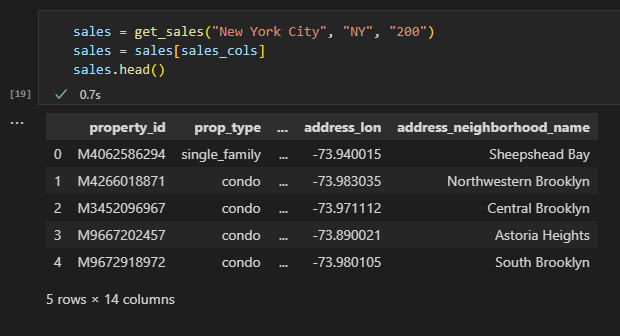
Initially, some functions were defined for the better organization of the code. As an example, below is the get_sales() function, which returns data about sales.
          def get_sales(city, state_code, limit):
          url = "https://realty-in-us.p.rapidapi.com/properties/v2/list-for-sale"

          querystring = {"city":city,"state_code":state_code,"offset":"0","limit":limit,"sort":"relevance"}

          headers = {
            "X-RapidAPI-Host": "realty-in-us.p.rapidapi.com",
            "X-RapidAPI-Key": "80d4101192msha3850ddbf66ba87p1c5dc9jsn7ad589c1b934"
          }
          try:
            response_sale = pd.json_normalize(requests.request("GET", url, headers=headers, params=querystring).json(), record_path="properties", sep="_")
            return response_sale
          except:
            print("Error")
get_rents and get_sold functions were also defined.
As some fields returned as NAN, the function to fill in the missing data was also defined:
          # Funtion to fill NAN values in the whole dataframe
          def fill_na(df):
              columns = df.columns.to_list()
              for col in columns:
                  if df[col].dtype == 'object':
                      df[col].fillna("NA", inplace=True)
                  elif df[col].dtype == 'int64':
                      df[col].fillna(1, inplace=True)
                  elif df[col].dtype == 'float64':
                      df[col].fillna(1.0, inplace=True)
              return df
Extraction
When executing the get_sales function, we get the following dataframe:
After doing the same with the rent and sales data, we run fill_na() function and check if there is still any NA value:
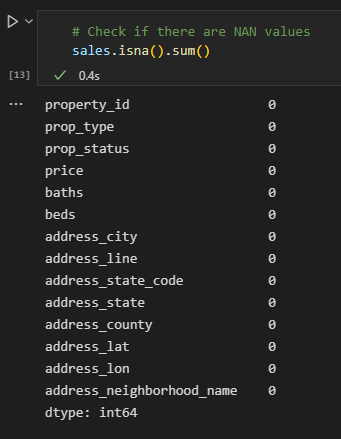
Now we are all set to load the data into the database.
Load
In this step, the cloud services from AWS were used. A MySQL instance was created using Amazon RDS. Using the pymysql package, the code below makes the connection to the database and creates the schema called realty.
              # Create a connection with the database service in local machine
              con = pymysql.connect(host ='db-realty.ctu8ks44oyou.us-east-1.rds.amazonaws.com', port=int(3306), user='admin', passwd='')

              # Creating a cursor object
              cursor = con.cursor()

              # Create a schema called realty
              cursor.execute('''
                  DROP SCHEMA IF EXISTS realty;
              ''')

              cursor.execute('''
                  CREATE SCHEMA realty;
              ''')

              # Use the new schema
              cursor.execute('''
                  USE realty;
              ''')
After that, we create the sales, rents and sold tables. Below is an example of sales data table:
              # Create tables SALES
              cursor.execute('''
                  CREATE TABLE sales (
                      property_id VARCHAR(12),
                      prop_type VARCHAR(20),
                      prop_status VARCHAR(20),
                      price INT,
                      baths INT,
                      beds FLOAT,
                      address_city VARCHAR(50),
                      address_line VARCHAR(200),
                      address_state_code CHAR(2),
                      address_state VARCHAR(50),
                      address_county VARCHAR(50),
                      addres_lat DOUBLE,
                      address_lon DOUBLE,
                      address_neighborhood_name VARCHAR(50)
                  )
              ''')
To effectively load the data into the database, we run the code below for sales table, and the same is done for the other tables.
              # Convert the Dataframe into a list of arrays
              sales_tuples = tuple(sales.to_records(index=False))

              for data in range(len(sales_tuples)):

                  # Create a new record
                  query = "INSERT INTO sales (property_id, prop_type, prop_status, price, baths, beds, address_city, address_line, address_state_code, address_state, \
                      address_county, addres_lat, address_lon, address_neighborhood_name) VALUES {}".format(sales_tuples[data])

                  # Execute the query
                  cursor.execute(query)
Finally, we commit and close the connection:
              # Commit
              con.commit()
              con.close()
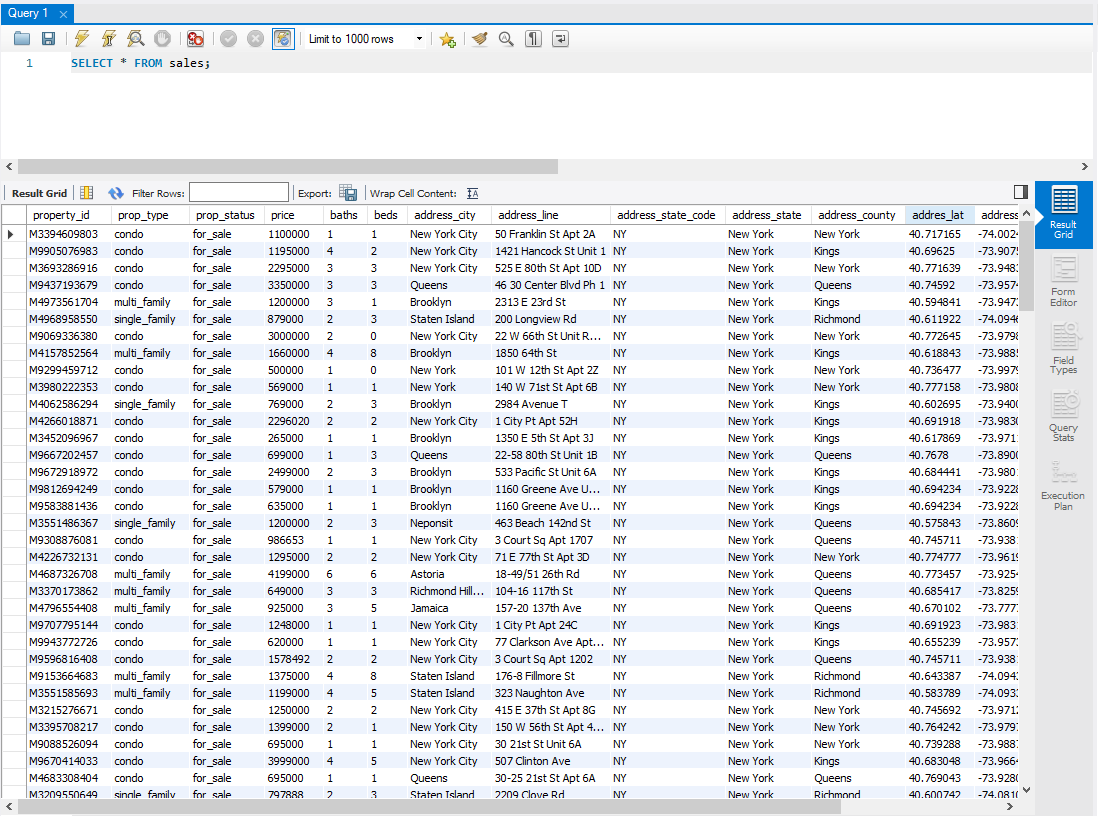
MySQL Workbench
We can access the database using MySQL Workbench software for better data manipulation. Below is a sample:
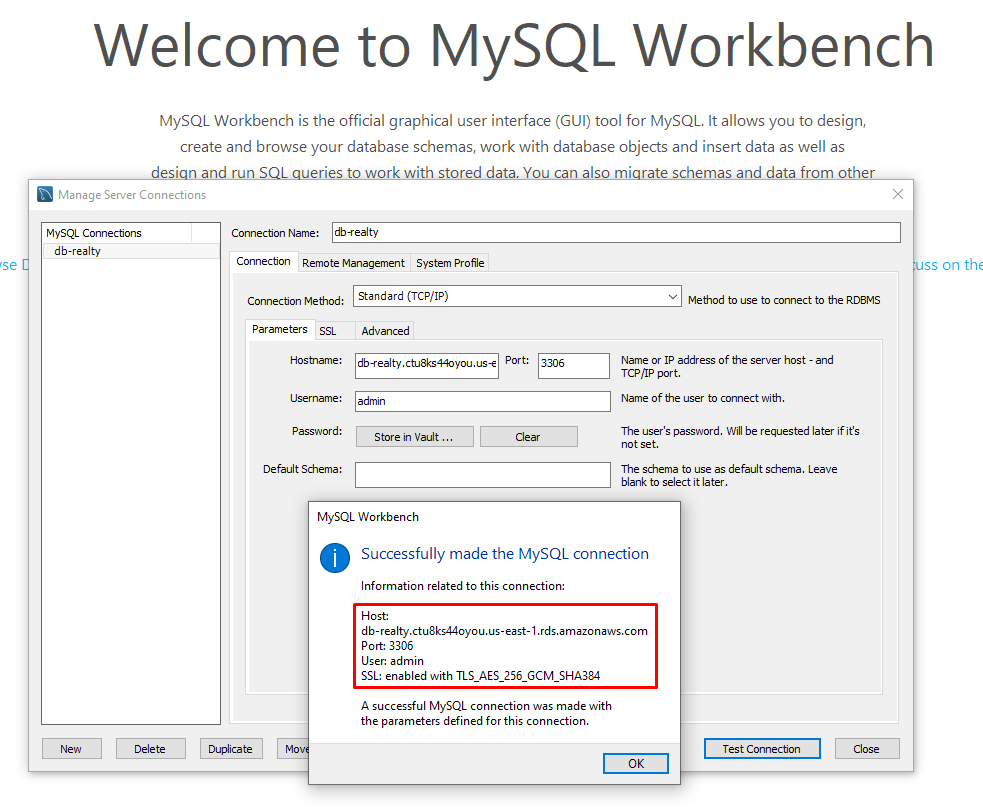
We can see the data is there:
AWS Lambda and Amazon EventBridge
To automate the entire ETL process, I used AWS Lambda service, which allows us to run code without having a server. I created a lambda function and added all the code shown earlier. For the external packages to work, it was necessary to add layers through the ARN found here.
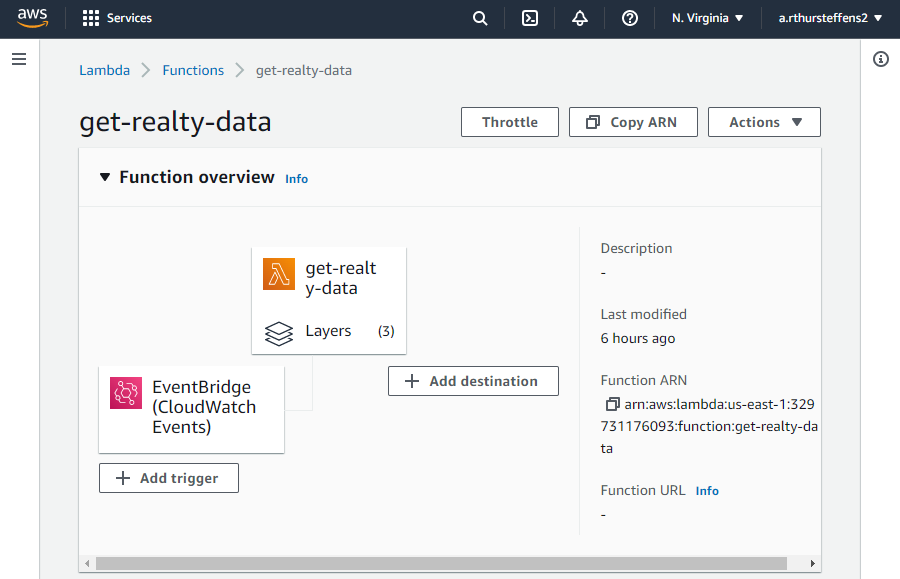
After that, a rule was created in Amazon EventBridge (CloudWatch Events) to schedule and automate the execution of the script. In the example below, I scheduled the run for once a day at 6 AM using a Cron expression.
              Cron expression
              0 6 * * ? *

              Next 10 trigger date(s)

              Fri, 27 May 2022 06:00:00 GMT
              Sat, 28 May 2022 06:00:00 GMT
              .
              .
              .
Next steps
As the data collected contains latitude and longitude of the properties, it would be interesting to collect data about the regions of New York, such as crime or air quality, for example, to match with our data and get more complete information about a particular property.
Also, we can use the same endpoint of our Amazon RDS database and make a dashboard in PowerBI or Tableau.
Ps: I couldn't find examples of some data containing latitude and longitude. If you know, please email me.
Project information
- Category: Data Engineering - ETL
- Project date: 25 May, 2022
- Project files: On Github